An app for exploring open data on clinical code usage
Choosing which clinical codes to use to identify a population or feature of interest in electronic health records is difficult without an understanding of how clinical activity is recorded in practice. To help make this easier, I made an app to explore open data on clinical code usage in England. You can use the app by clicking the badge below and read more about why I created it and how it works below.
![]()
Contents
- Clinical codes and terminology systems
- Identifying patient populations with clinical codes
- Open data on clinical code usage
- A data app for exploring the data
Clinical codes and terminology systems
Electronic health record (EHR) research relies on identifying symptoms, diagnoses, prescribed medications and test results within patient records. Whilst some of this information is contained within free text, a large proportion is contained within structured data in the form of clinical codes. Different clinical terminologies — structured collections of codes with descriptions — are used to represent different aspects of clinical practice. SNOMED CT is an example of one of these terminology systems, which is mandated for capturing clinical terms within EHRs for all NHS providers in England.
Identifying patient populations with clinical codes
Clinical codes are not always used as you would expect and there are often multiple ways to code the same concept. This is beneficial for clinicians as it allows flexibility in coding, but is problematic for researchers when choosing codes to identify particular patient populations. Even though each code has an associated description, deciding on which codes to use requires an understanding of how a clinical area is coded in clinical practice. Sometimes a single code is all that is required, but often there are multiple codes that can be used to capture a specific clinical area, so a set of codes have to be combined into a codelist. Creating codelists is a crucial step in EHR research as errors introduced in this step can result in bias that propagate to downstream analyses.
It is therefore useful to be able to see how frequently individual codes are used in practice.
Open data on clinical code usage
In May 2023, NHS Digital released summary counts of the usage of individual SNOMED CT codes in primary care in England. This contains the total number of times each SNOMED CT code is added to EHRs in England each year from 2011 to 2022.
The dataset is made available as a single file for each year, with years running between 1st August and 31st July. Data prior to 2019 was predominantly submitted using Read Codes (v2 and v3/CTV3), which are now deprecated. These codes have been mapped forward to corresponding SNOMED CT codes.
What does the data include?
The data contains the following information for each code:
SNOMED_Concept_ID- Numeric codes representing SNOMED CT concepts which have been added to a patient record in a general practice system during the reporting period.Description- Description associated with the code.Usage- The number of times the code was added into any patient record within the reporting period.Active_at_Start- Whether the code is active on the first day of the reporting period (1st August).Active_at_End- Whether the code is active on the last day of the reporting period (31st July).
This is an example of what it looks like:
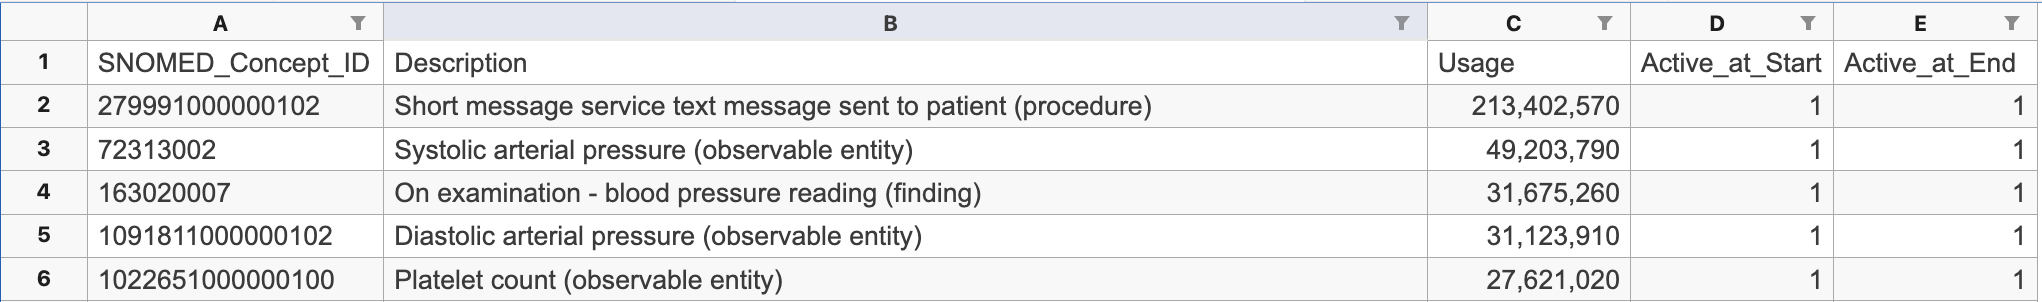
Each file contains ~100k rows, with the exact number varying depending on the number of codes used. Codes with no usage are not included in the data.
Why is the data useful?
There were two main reasons for wanting to explore the data:
- Help with codelist creation. When creating a codelist, you often have to make choices on a large number of codes. If these are codes that are not used, this is needlessly time consuming. I wanted a way to quickly see if a code is used in practice and if so, how often.
- Assessing usage of codes within an existing codelist. As codelist creation is a common task in EHR research, it is possible someone has tried to make a codelist you need before. OpenCodelists is an open platform for creating and sharing codelists that contains a large library of codelists covering multiple terminology systems and clinical areas. I wanted a way to explore whether existing codelists are appropriate by checking if they capture the volume of activity expected.
Barriers to exploring this data easily
There are two main barriers to exploring this data easily:
- The data is split into separate yearly files provided in different file formats.
- It is not easy to filter out the usage for the codes you are interested in.
My aim was therefore to combine all the data and make it easy to query the data for an individual code or set of codes.
A data app for exploring the data
To allow easier exploration of the data, I made a data app using Streamlit, an easy way to build apps on top of data using pure Python. It supports various page elements including input widgets and charts, which can be combined to build a basic UI on top of a dataset. This was a good option for what I wanted as it would allow display of counts and charts of code usage following user input, which could be a single code as text input, multiple codes in a local file or an existing codelist on OpenCodelists.
The code for the data processing and the app are available on GitHub.
Dataset summary
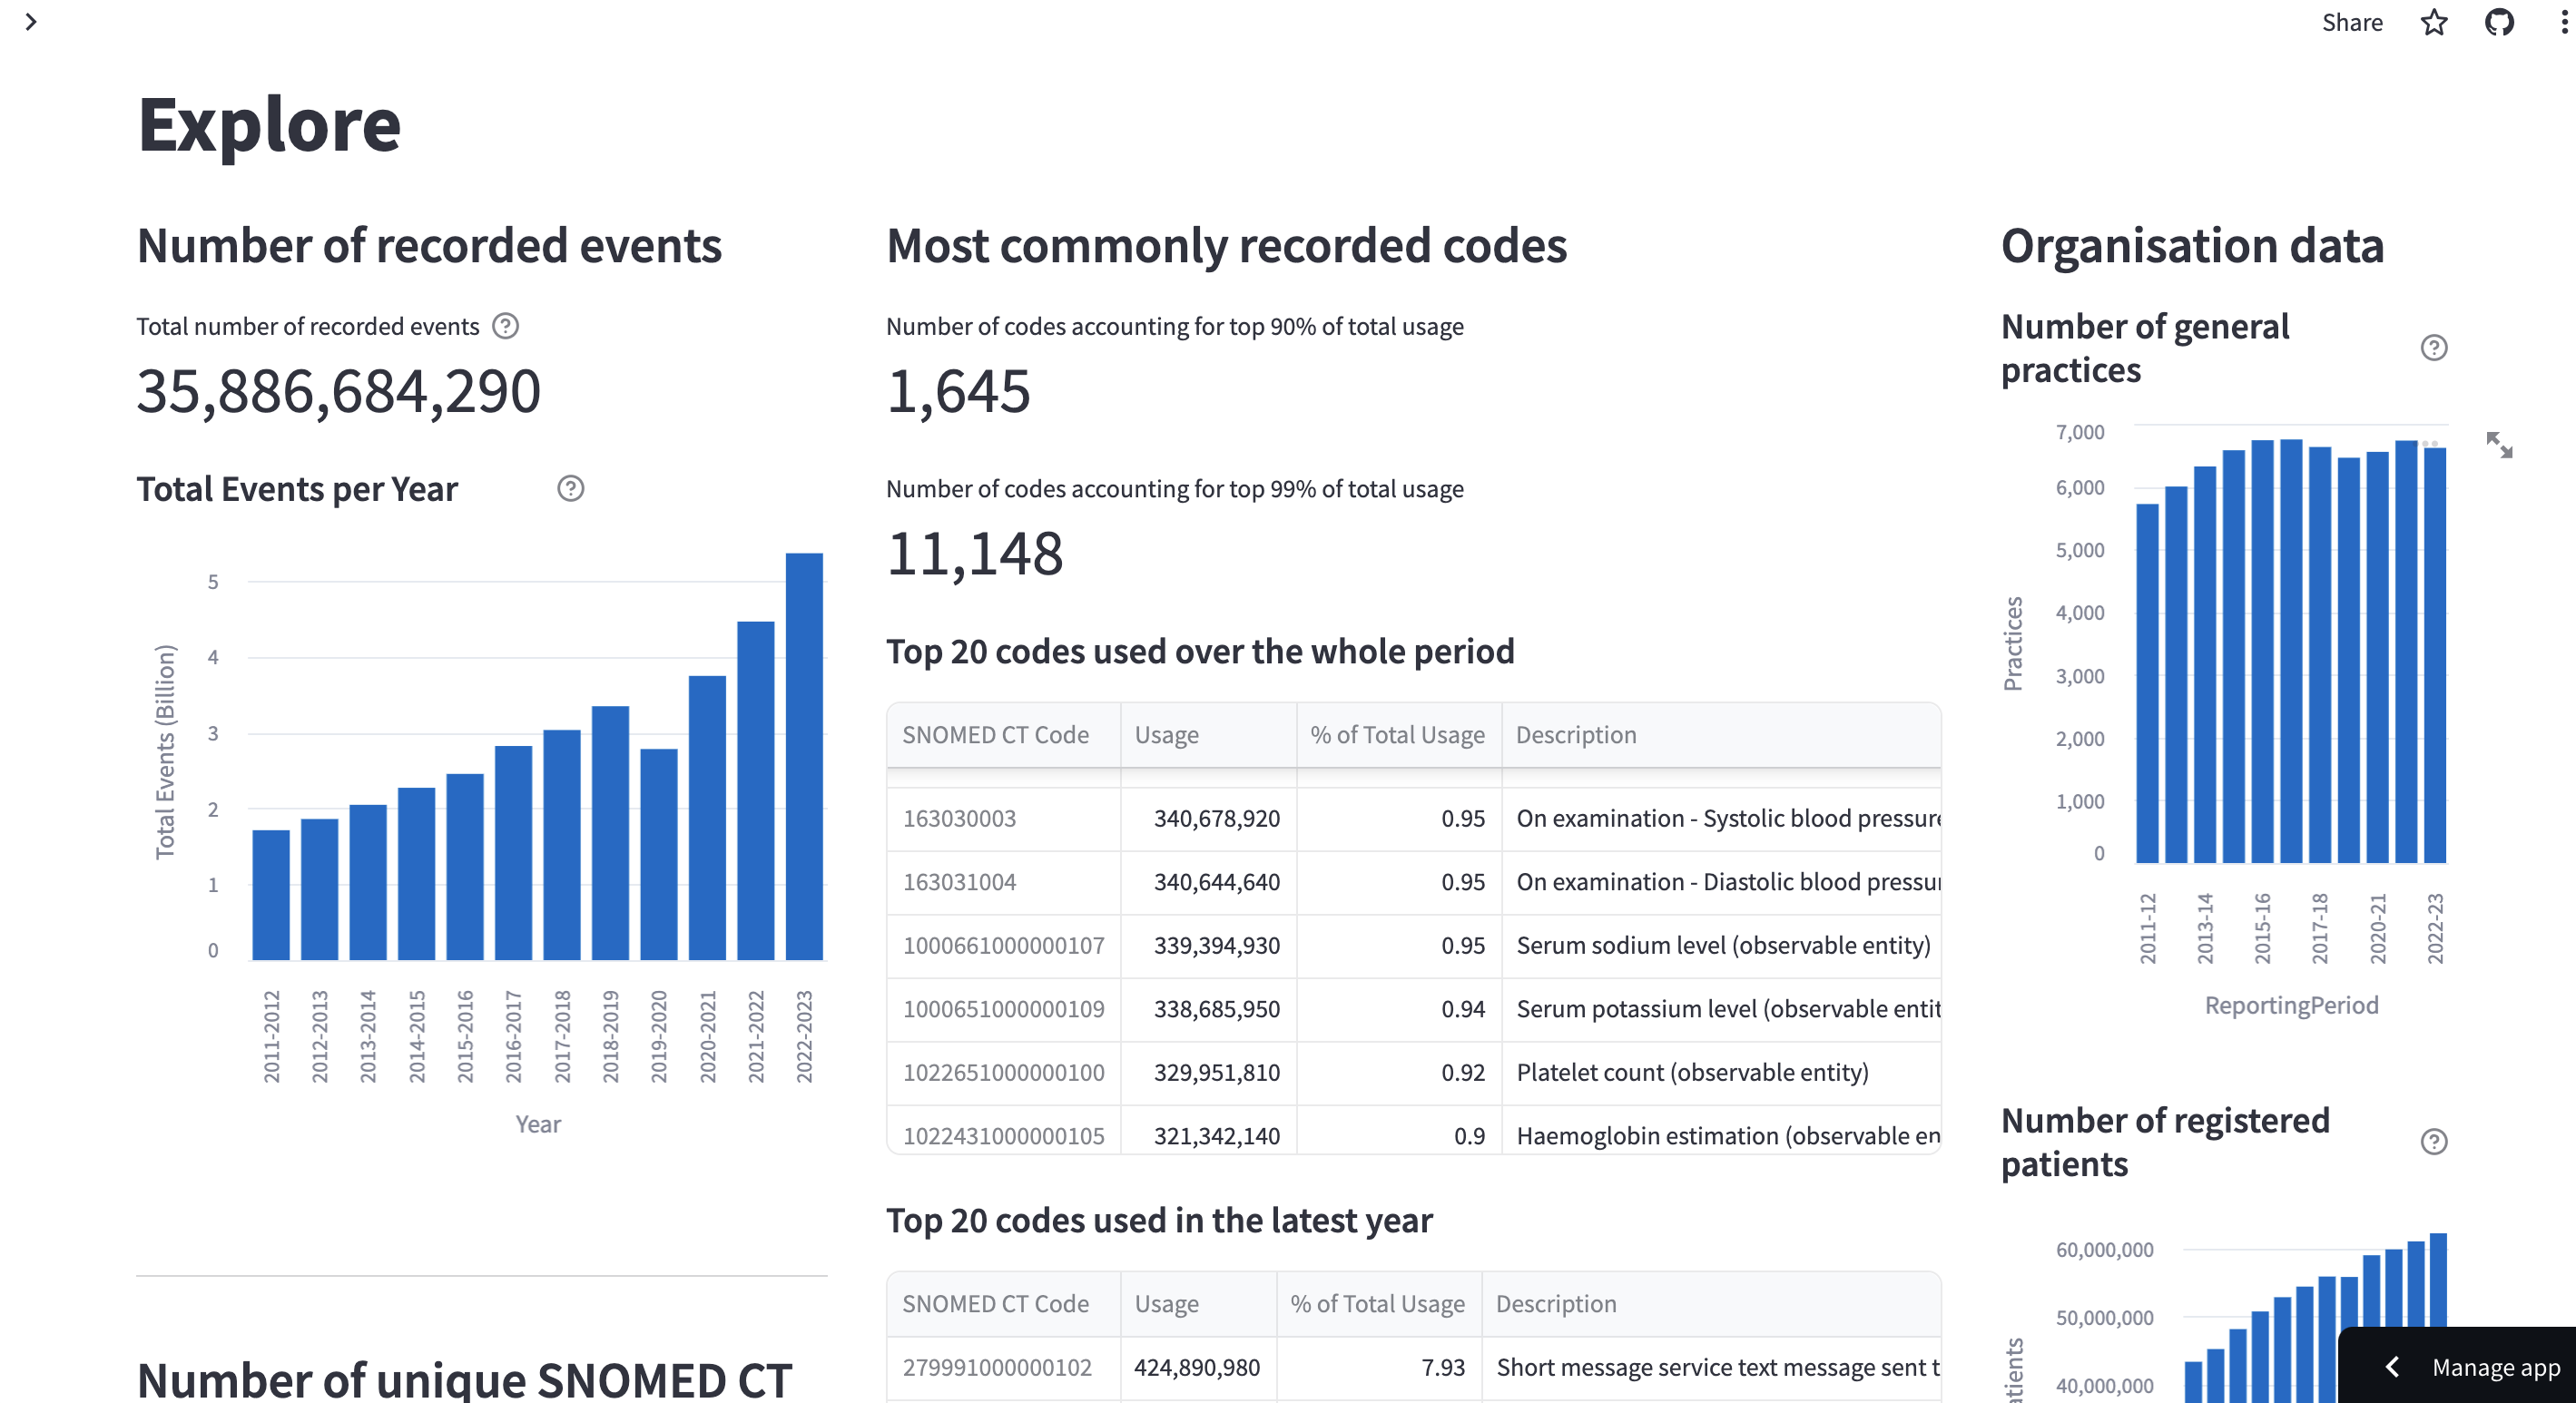
The first page of the app is an Explore page that shows some high-level details about the available data. This includes the total usage of any code over time, the number of unique codes used and the most commonly used codes. A large proportion of the recorded code usage is made up by a small number of codes.
It also shows some details for metadata provided with the data, including the number of patients represented in the data and the number of general practices these patients are registered at.
Exploring code usage
There are 3 options for exploring code usage:
- Entering a single code - Explore usage over time for a single code.
- Uploading a codelist - Explore usage over time for a list of codes in a local codelist.
- Providing a url to a codelist on OpenCodelists - Explore usage over time for a list of codes on OpenCodelists.
Exploring use of a single code
Below are the results when entering a single code 59621000 - Essential hypertension (disorder).
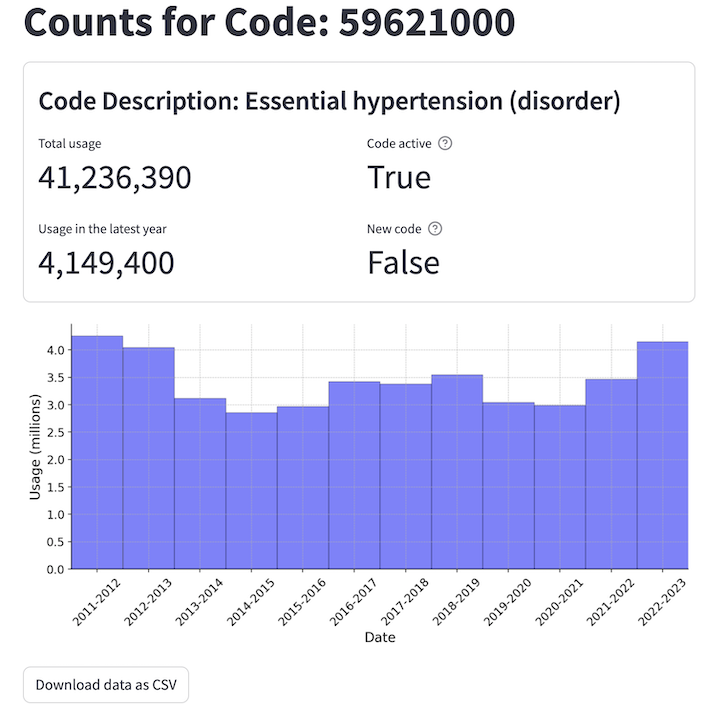
You can see the total usage across the reporting period and in the latest year. There is also an indication of whether the code is currently active (marked as active_at_end) and if the code is new in the latest year (marked as active_at_end but not active_at_start of the latest year).
Finally there is a bar chart showing the usage of the individual code over time. This code is used to record a common disorder so has a lot of usage.
Exploring use of multiple codes
The usage of multiple codes can be explored by uploading a codelist as a .csv file. Alternatively, a link to an existing codelist on OpenCodelists can be provided.
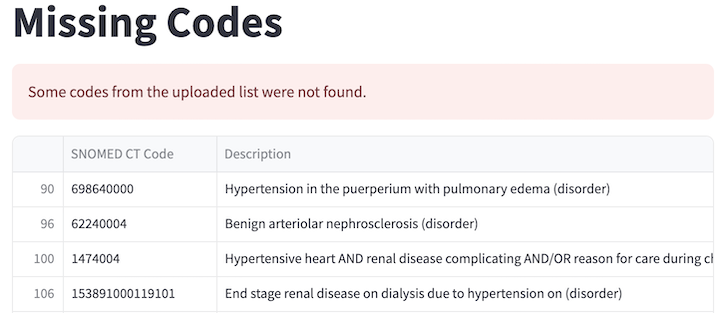
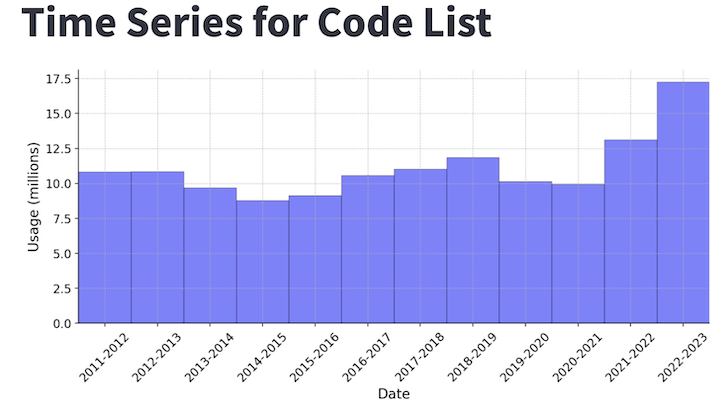
Below are the results for a codelist for hypertension from OpenCodelists.
The first thing shown is a list of any codes in the chosen codelist that are not present in the dataset. These are codes which have not had any usage recorded across the time period. This can be used to prune unused codes from a codelist, though it is possible these codes may be used in the future.
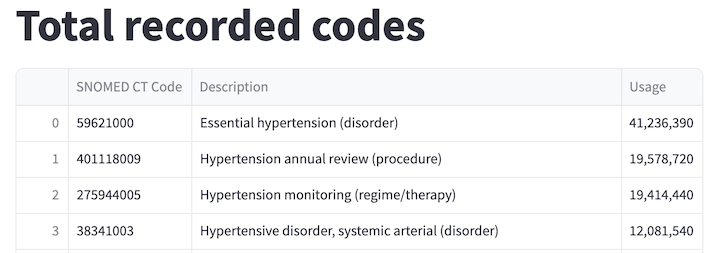
Next, the total usage for each code across the entire reporting period in the codelist is shown as a table.
Time series charts are then shown for the total usage across all codes each year as well as each individual code.
Summary
By aggregating publicly available data on coding activity and making it easy to query it is easier to understand how a clinical area is recorded in EHRs in England. I hope this will make development of codelists for EHR research easier alongside tools like OpenCodelists.